Roleplay is an experimental computer tool that lets you create models of social and physical systems, link them to real-world data, and to understand their behavior and implications.
It is inherently visual and relies on many familiar representations like maps and graphs. It feels like a board game: you work directly with the objects on the map and define the model by drawing on a canvas and moving tokens.
LEGENDARY
The geographic map is the quintessential visual representation of data. Maps are usually structured such that most of space is devoted to visual marks, and a nearby legend explains what these marks mean in terms of the underlying concepts.
Many of the great data visualizations follow the same pattern: there is the visual part with an assortment of colorful marks and a substantial amount of space devoted to the “How to read it?” section where the meaning of marks is explained.
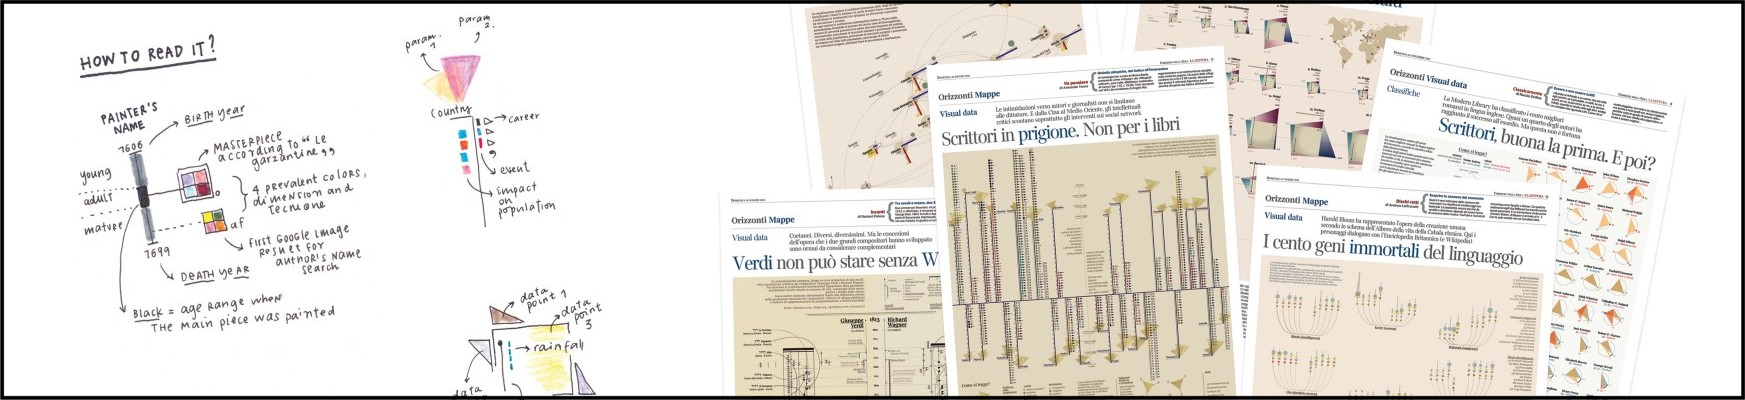
For example the work of Giorgia Lupi and Stefanie Posavec.
The way this works in software for creating these representations (from simple plots in spreadsheets to complex GIS tools) is the same: there is the underlying data in tabular form, the human specifies how to convert values in tables into plot elements, and the computer generates the plot. The tables->marks conversion may be more or less explicit, but it is always there. Changing the plot means changing the tables and letting the computer update the plot. This is powerful, but not exactly direct: you modify some symbols to see how this changes the visuals (which are usually the main mechanism for perception).
Roleplay inverts this mapping by letting the humans work directly with the visual representations and letting the computer generate the data that is consistent with the map created by the human. Crucially, the humans still specify the familiar tables->marks relationship, and let the computer figure out what the corresponding marks->tables procedure is. The role of the human changes from “table-manipulator” to “pattern-manipulator” and the role of the computer from “plot-generator” to “plot-interpreter”.
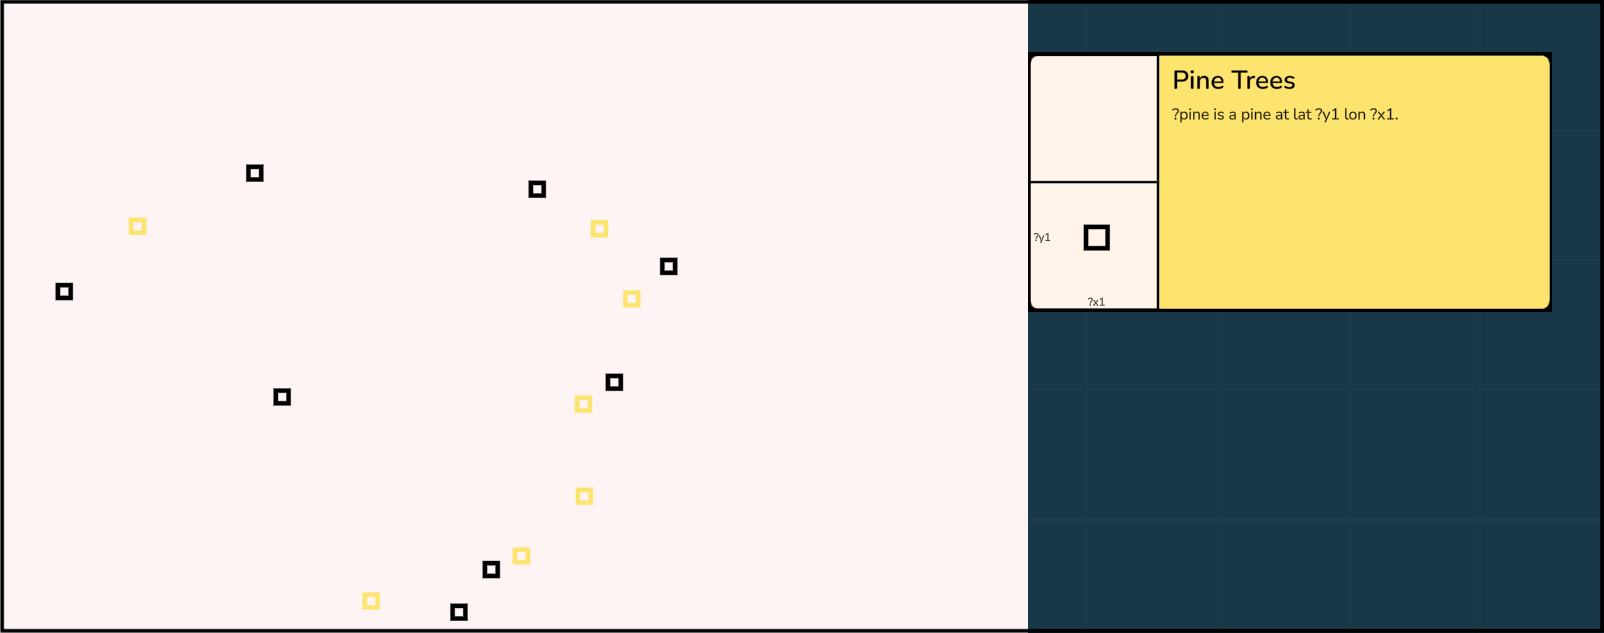
The role of the legend in Roleplay is given to lenses which specify the precise mapping from some underlying tables to the marks seen on the board.
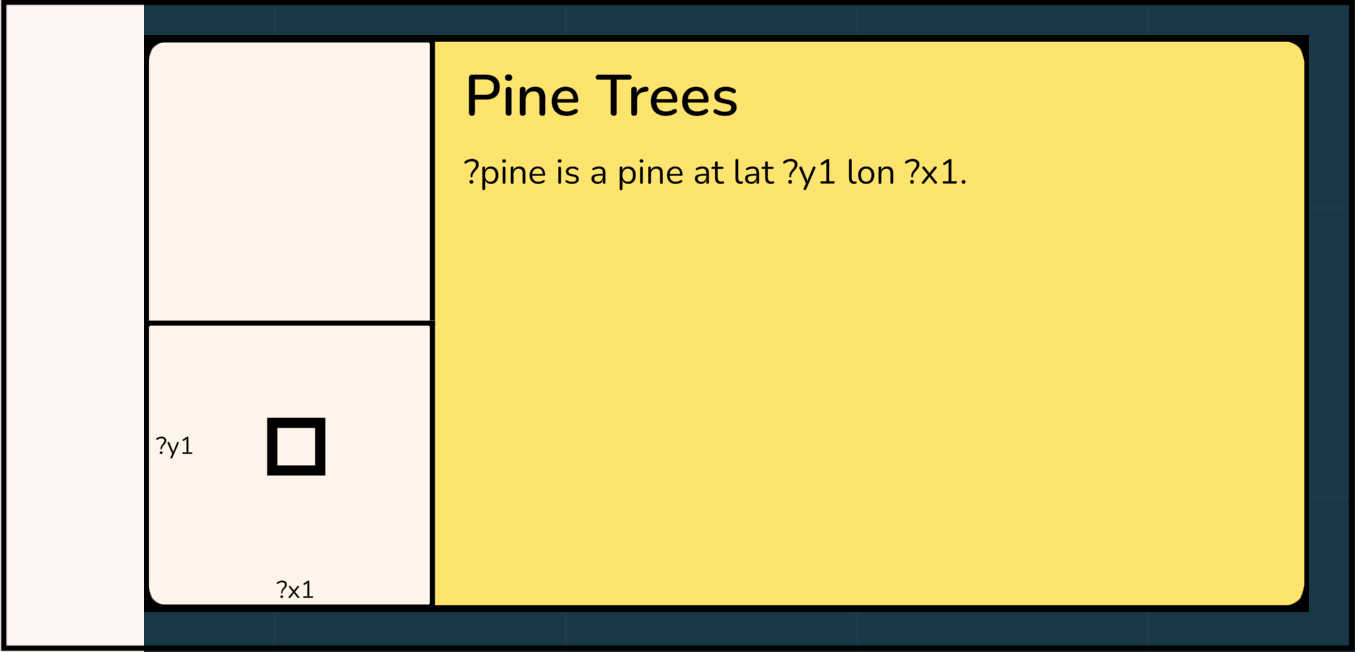
There are two main components in a lens:
-
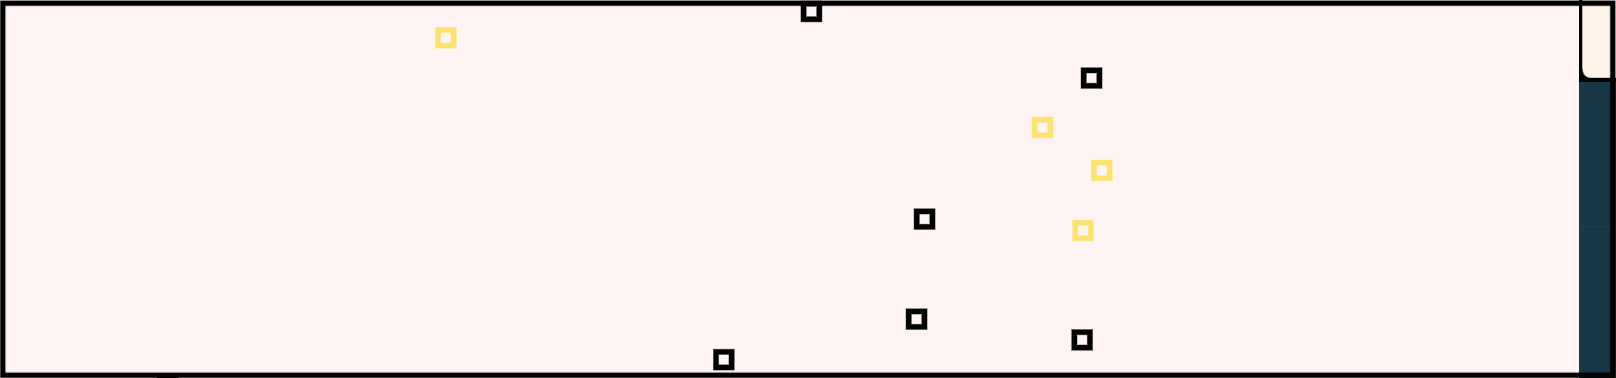
Mark templates (e.g. □ or ○) define composite glyphs that would be generated if we converted tables to marks as usual. Instead, Roleplay will use these glyphs as patterns to search for on the board, and once found, will measure the visual characteristics such as position and color. In this case, it will search for black unfilled squares of this size and will measure their x and y coordinates.
-
The definition of how to map an underlying table to a mark. The language is textual and is based on natural language datalog. Each table is defined by a sentence that has some of its words missing and which can be filled in with specific values or variable names (which begin with a ?). Each lens defines a set of rules (similar to SQL views) that generate new temporary tables whose results may be used by further rules. Each lens also contains queries that take the output of a rule and have some variable slots filled with the special “measurement” variables present in the glyphs, e.g. “?x1” corresponding to the x-position of mark 1.
The two components of the lens then interact such that the measurements of the marks that were found on the board are mapped to the corresponding slots of the queries. The implication is that the underlying tables could have generated the output of the queries with values corresponding to the measured glyphs.
EMBRACING THE AMBIGUITY
The usual direction of the visual mapping, tables->marks, is straightforward. The computer looks at the tables, checks all of the rows that satisfy the constraints, drops the values not mapped to visual properties, and uses the remaining values to generate the marks.
The inverse relationship, where we need to generate the tables based on marks, is not so simple for multiple reasons. First, if we only observe the marks, we don’t have any information about the not-mapped values that have been dropped (the ?pine in the image above). Second, we do not know about the presence or absence of the rows that did not satisfy the constraints. Finally, even in the ideal scenario of an unconstrained row mapping all of its values to visual properties of marks, we still have visual ambiguity to deal with: marks could cover each other or have multiple explanations for the same observed shape.
Fortunately, there is a principled way to deal with all of these issues, and that involves embracing the ambiguity and treat everything probabilistically. We do not know exactly the contents of the underlying tables, but we can make judgements about which tables are more or less likely.
Every combination of the underlying tables T provides a particular set of marks M using the forward tables->marks mapping. We only observe M, and may have some weak prior beliefs about the values in T. We can then compute the probability of a particular T given that the marks are M. In other words, we ensure that the tables we have in T, when passed through the lenses in tables->marks direction, would generate visual patterns similar to the pattern we observe.
PEEKING AT THE UNOBSERVABLE
This capability of having a distribution over likely tables is very powerful, since we are not restricted to only viewing the patterns we have defined.
This directly reflects how most science is done: the patterns of marks are like “data” that somebody somewhere has observed. The lenses explain how these must have been generated, based on some underlying unobserved (and unobservable!) processes. Combining tokens and lenses gives Roleplay information about these underlying processes and it can generate representative samples of how the unobserved parts of the system behave.
These samples could reflect the underlying not-directly-measurable parameters that govern the system’s behavior, or they could be possible histories of how the unobserved parts of the actual system developed. They could even cover future predictions and counterfactuals that cover multiple scenarios of possible evolution.
These samples can be viewed by the humans in the context of the original model. But they can also be exported onto independent cards that carry a compact representaiton of a specific part of the model. These cards can then be shared and incorporated into new models without the need of bringing all of the original data along.